
Memory profiling on windows for C++
Memory profiling C++ is a complicated topic. Based on the level of complexity of the language it is also one of the most important topics to consider. This is due to the lack of a garbage collector and the power that you as a developer will have with the language. As they say with great power comes great responsibility.
For games, you would also want to structure and analyze your memory carefully so that your games stay within a set budget – especially when you are developing for game consoles which may have lower specs than your average PC.
Table of Contents
- Why would I need to profile on Windows?
- Example memory leak
- Using Windows’s CRT library for memory profiling
- Visual Studio tools – memory usage profiling
- MTuner – a memory profiling tool
- Conclusion
Why would I need to profile on Windows?
The most popular memory profiler in the C++ world is called Valgrind. The problem is though that it is only available on Linux-based operating systems. Games though (especially for consoles) are developed on Windows and you would need a tool for reliably profiling your applications and games.
Also, C++ is a complicated language in terms of managing memory and you will often forget to release objects from your RAM causing the so-called memory leak. Memory leaks could be caught using simply your programming skills but they are quite tricky even for an experienced programmer to fix.
Example memory leak
Memory leaks are one of the most important things you would want to look for in a program. They might be quite tricky to get sometimes. It is very important to have a clear structure in your program which class should handle the memory allocation and release for a certain other class. This can be achieved trivially by using shared_ptr, weak_ptr and unique_ptr from the standard library. To learn more on the topic I would suggest you watch some of the videos of The Cherno like this one about pointers.
I have an example code that is badly written for the purpose of this article. Let’s say we have the code to calculate factorials. We also want to have a counter that is passed between the function. It counts every time we pass by a value of n that is a multiple of 5. I have made a leak in the code on purpose. Every time we meet that number we create a new counter object. We then copy that object into the previous one. But we will also leave the newly created object unreleased from memory – a leak.
#include <iostream>

struct Counter {
    int value;
};

long factorial(short n, Counter& counter)
{
    if(n % 5 == 0)
    {
        Counter* otherCounter = new Counter();
        otherCounter->value = counter.value + 1;
        counter = *otherCounter; // Copied but also left unreleased
    }

    if(n > 0)
    {
        return n * factorial(n - 1, counter);
    }

    return 1;
}

int main()
{
    Counter* counter = new Counter();
    std::cout << factorial(10, *counter) << std::endl;
    std::cout << counter->value << std::endl;
    return 0;
}
Using Windows’s CRT library for memory profiling
The first option that you can try when debugging your memory usage is to add some code that will profile it for you. It is as simple as adding just a few lines of code and then running the application. You could also do a more sophisticated profile of your code for certain points of the application or per game frame.
The simplest option would be to add the necessary header files and just some setup code inside the start of your main method:
#define _CRTDBG_MAP_ALLOC
#include <stdlib.h>
#include <crtdbg.h>
int main()
{
//...
_CrtSetDbgFlag ( _CRTDBG_ALLOC_MEM_DF | _CRTDBG_LEAK_CHECK_DF ); // This is used to auto output memory information about leaks before closing the application
_CrtSetReportMode( _CRT_WARN, _CRTDBG_MODE_DEBUG ); // Set to output into your IDE's debug window
//...
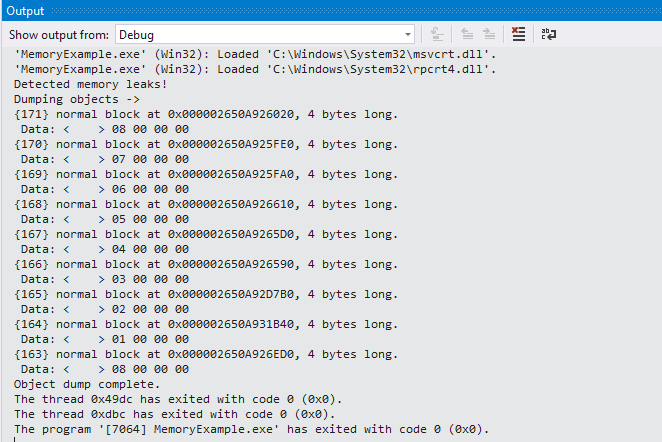
}This example code is the minimum I would advise you to always use whenever working with C++. It would detect basic memory leaks when your application closes helping you identify that a problem exists closer in time to when it was introduced. An example output as shown in Visual Studio’s output window would be:
To extend this further you would probably want to make snapshots at specific points which you can compare. To do this it is pretty basic on top of the includes we added above:
_CrtMemState oldState;
_CrtMemState newState;
_CrtMemState stateDiff;

_CrtMemCheckpoint(&oldState);

// ... Do some memory action

_CrtMemCheckpoint(&newState);

if (_CrtMemDifference(&stateDiff, &oldState, &newState))
{
    // Simple statistics between the state
    _CrtMemDumpStatistics(&stateDiff);

    // Dump all created objects
    _CrtMemDumpAllObjectsSince(&oldState);

    // Dump the memory leaks up until now
    _CrtDumpMemoryLeaks();
}
As you can see you can capture snapshots for memory profiling that will help you investigate certain points of your application.
This method is usable in multiple IDEs though it was a bit hidden in CLion where I also tested it. I found the output information inside the Debugger tab’s LLDB section.
Visual Studio tools – memory usage profiling
First I want to quickly dismiss the concept that VS will help you much with memory profiling. Visual Studio 2019 has a nice set of tools for analyzing the memory usage of an application but you will mostly get so far as you would with the method described above. You can pretty much check the memory usage at different points in the execution of the application while debugging. This is done through the “Diagnostic Tools” window.
This is better shown with an image than described:
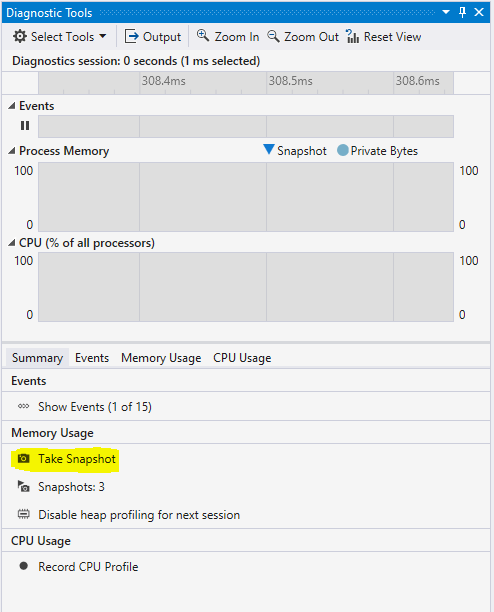
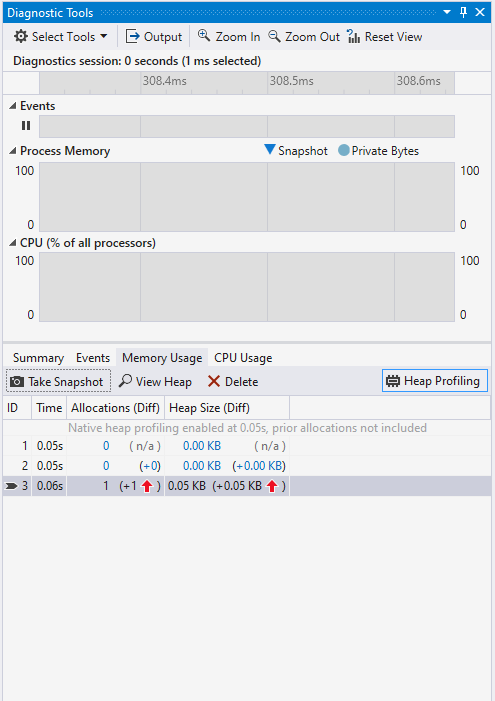
You will be able to take snapshots and compare how the memory usage has changed from point A to point B. But that is pretty much the extent of it. Maybe one more thing is that there is a useful “View Heap” button that will show you the type of the allocated classes between each snapshot.
MTuner – a memory profiling tool
A nice application that does memory profiling on windows is MTuner. It is an open-sourced project. I was really amazed by the power of that application. It is a simple to use application that you start and then you drag and drop the application you want to profile. It will immediately execute that application and provide you with information about its memory.

Just by looking at the first window that opens, we can see that our MemoryExample application has only allocations and no memory is ever freed. It also has a timeline view of all allocations and stack traces of when and where they happen.
This project was a life saver for me and I strongly recommend it in front of all other solutions. It is non-invasive. It doesn’t require you to implement any code for it to run. You just need to drag and drop your application and that is it. Consider contributing or supporting the project in any way as the tools available for windows are pretty sparse.
Conclusion
This was a short article on memory profiling for Windows but I hope that anyone out there finds it useful. I sometimes find it hard to find information on such simple topics for the C/C++ language. I was surprised that memory profiling is not that well explained or supported on the Windows front. CLion is supporting only Valgrind out-of-the-box and Visual Studio’s integrated memory profiling is only a memory usage visualizer.
For other interesting topics in the world of C/C++ development, you can check out some interesting articles about build automation or how to get started with CMake for project structuring.

Indeed it is only a send out email for the blog. Otherwise you can contact me at hristo.konstantinov.stamenov@gmail.com or through my linkedin profile: https://www.linkedin.com/in/hristokonstantinoviliev/

I wrote to hristo.stamenov [at] thatonegamedev [dot] com but it seems this email is not valid...
My social media links are on the main page
Dear Hristo, great article! I am a developer of a profiler for C++. How can I contact you?
Leave a comment